
2026 NLL Player Rankings: Who Teams Rely on the Most
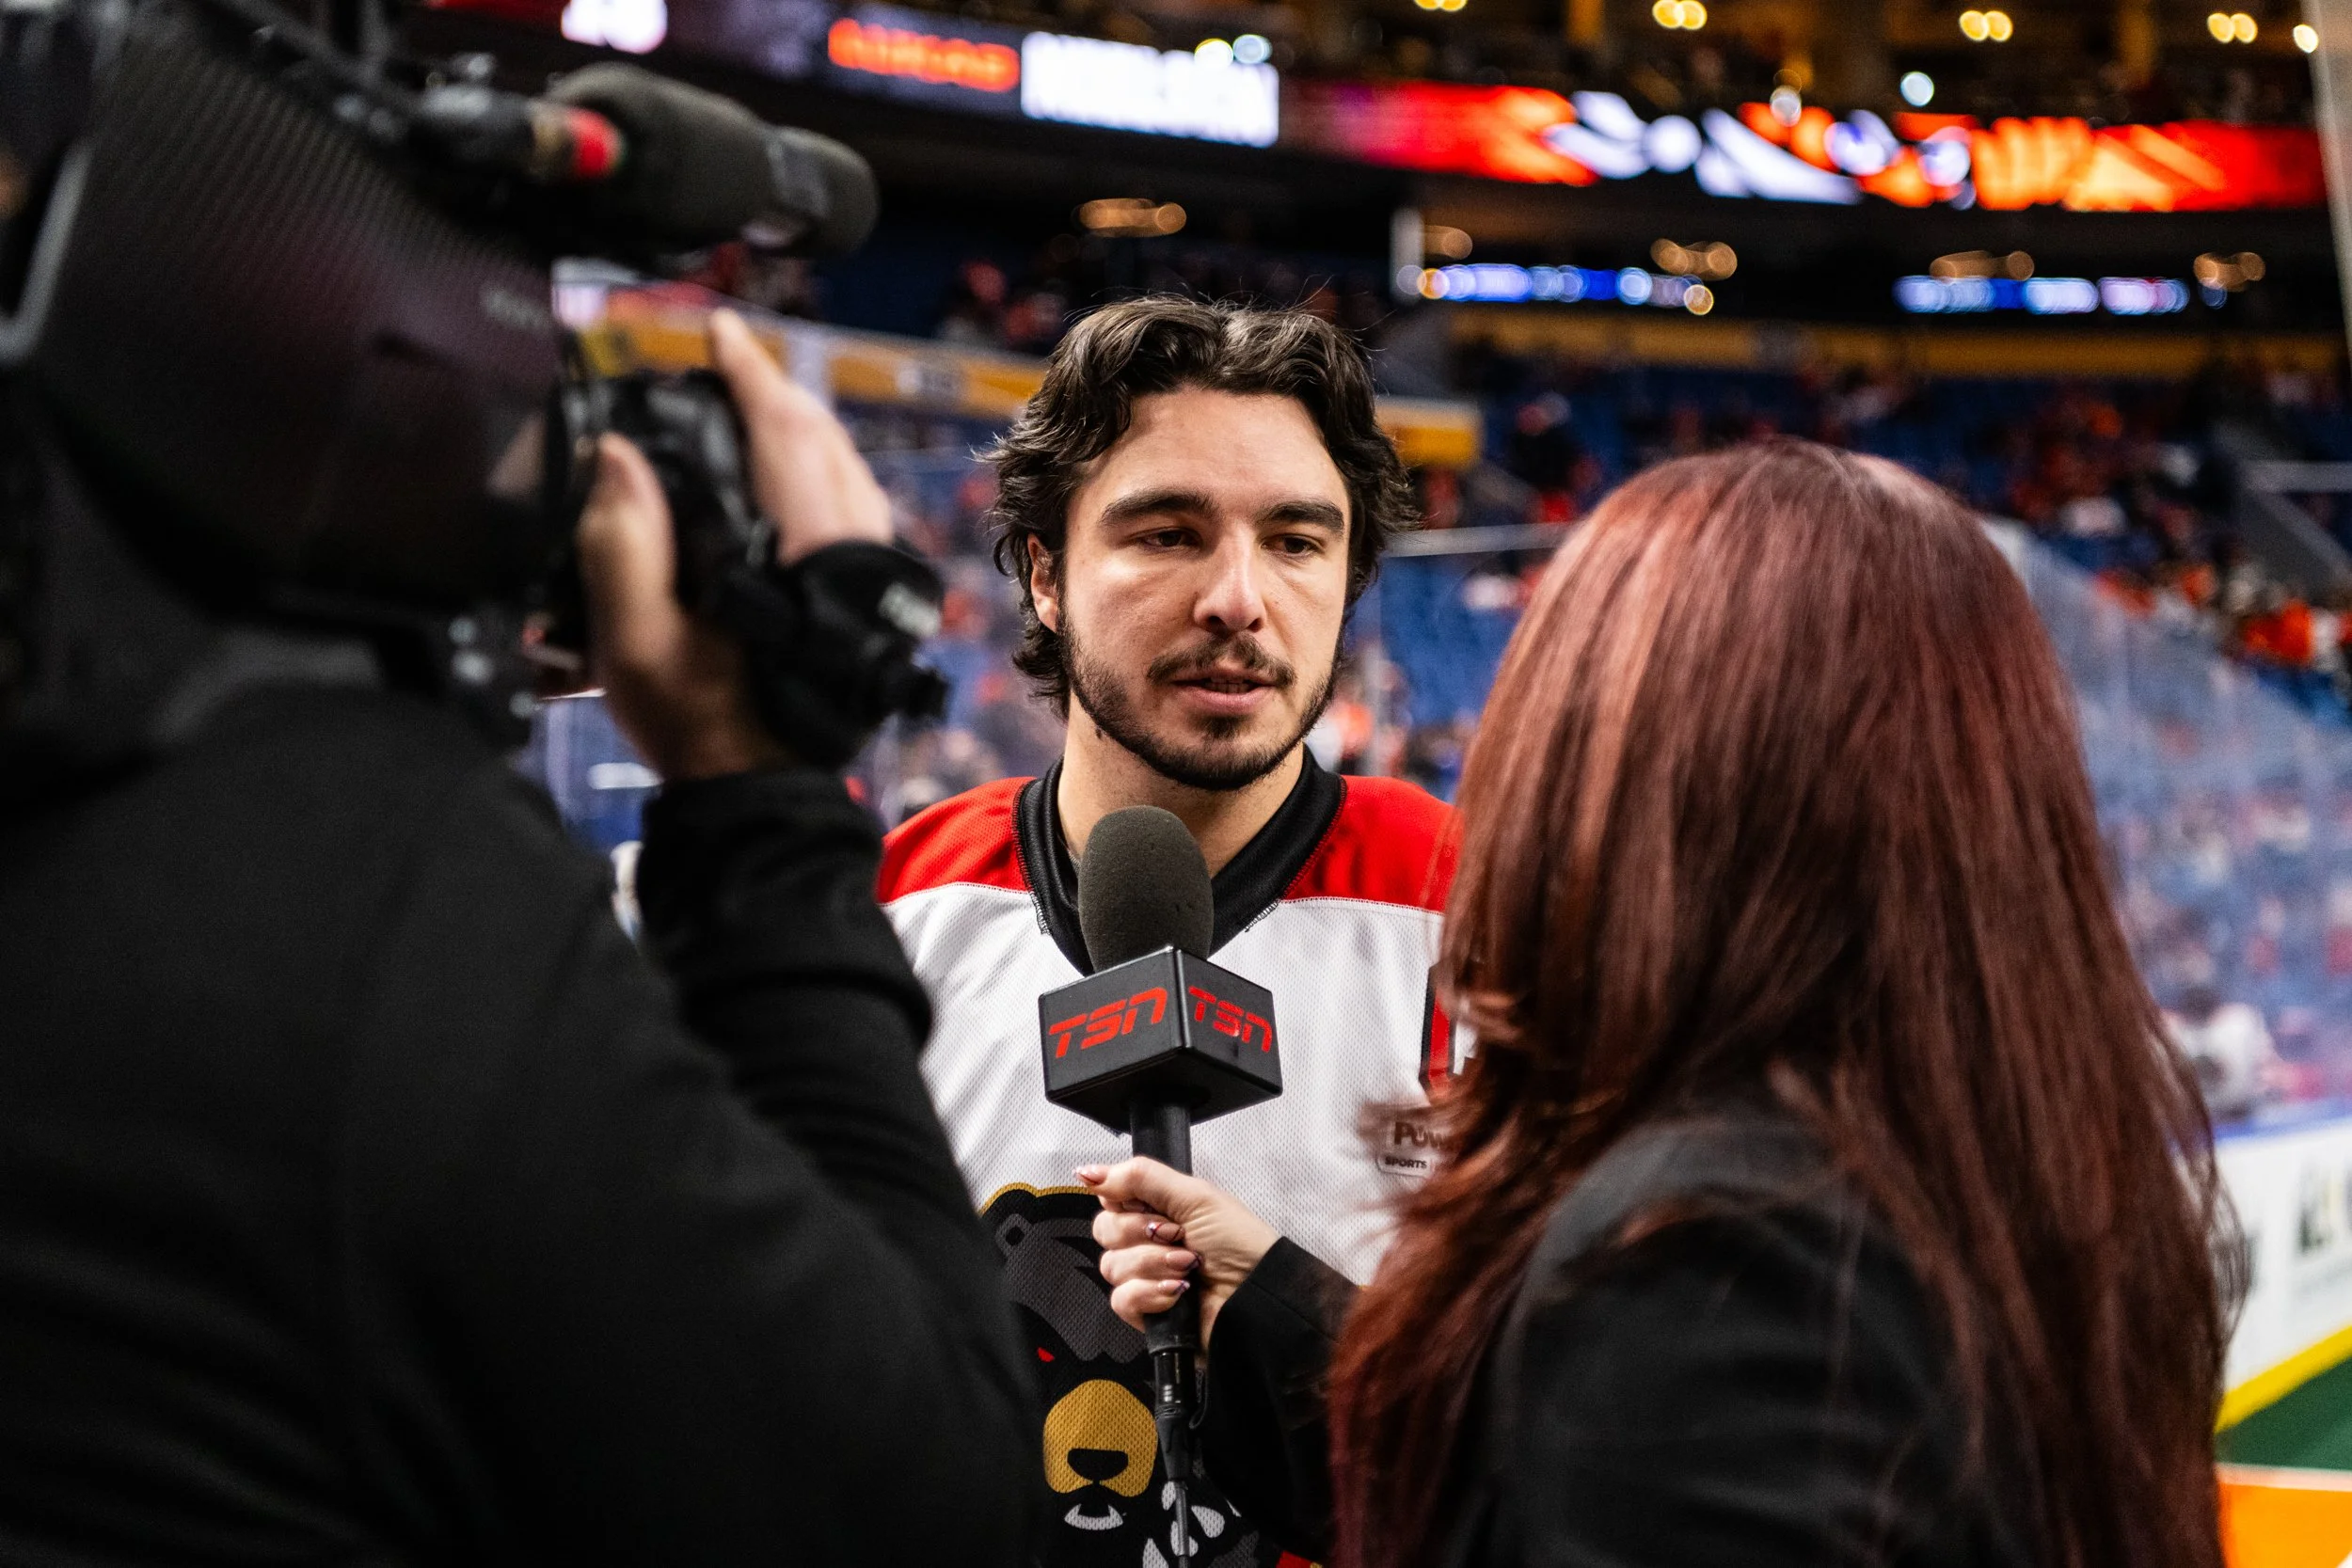
Jeff Teat, Ottawa Black Bears (Photo: Caroline Sherman)
After the first several weeks of the 2025-26 National Lacrosse League season are complete, The Lax Mag publishes a weekly NLL Player Ranking, examining the league’s Top 30 players from Week 1 right up until the end of the regular season.
TLM’s Top 30 NLL Player Rankings have nothing to do with reputations, career resumes, success in past seasons, whether we know a player personally, recognizing deserving players who’ve previously been passed over, player popularity, the size of their social media following, whether you slide into their DMs, or who others around the league tell us should get hype.
Our rankings, which only take into consideration only a player’s performance for the current regular season, will be calculated using both our star-rating system after each game, but also a player’s season-long statistical position (based on per-game averages) across the league. Only players who have played two-thirds of their team’s games or more will qualify.
Click here for an even more in-depth breakdown of our scoring system.Earlier this season, we examined which players were seeing the most significant increases and decreases statistically in a variety of offensive and defensive stats versus a season ago.
Jeff Teat, Ottawa Black Bears (Photo: Greg Mason)
In this week’s NLL Player Rankings, we examine which players teams rely on the most for various offensive and defensive statistical production.
This is an area that Jeff Teat has dominated in most past seasons, the New York Riptide and last year’s Ottawa Black Bears relying on him for a waaaaay above average amount of offensive production, both in straight goal scoring and setting up teammates.
While Teat still ranks absurdly high in 2026, he no longer easily leads these reliant-heavy lists, largely due to the addition of Rob Hellyer in Ottawa over the offseason, who has taken on some of that offensive burden.
Below are how many goals and points Teat has produced in every season so far, including the percentage of the team’s goals he was scoring (Goals) or scoring and assisting (Points) on.
2022 - New York
Goals: 37 / 214 / 17%
Points: 108 / 214 / 50%
2023 - New York
Goals: 56 / 201 / 28%
Points: 136 / 201 / 68%
2024 - New York
Goals: 58 / 206 / 28%
Points: 130 / 206 / 63%
2025 - Ottawa
Goals: 56 / 183 / 31%
Points: 111 / 183 / 61%
2026 - Ottawa (After 16 Games)
Goals: 40 / 173 / 23%
Points: 106 / 173 / 61%
While the point percentage still sits above 60% (which means the club continues to rely on him heavily for their overall offensive production) that goals % is the lowest we’ve seen since Year 1, when Teat had plenty of support from Callum Crawford, who was dealt very early the next season.
Teat has averaged just 1.67 goals per game over Ottawa’s last three: all losses.
So, while Teat is still relied on at a ridiculously high rate in comparison to most of the rest of the league, in 2026, who are the handful of players that teams are leaning on even more for their production?
See who teams are relying on the most for their offensive and defensive statistical production this year in the following categories: goals, points (goal or assist on a team goal), loose balls, caused turnovers, and blocked shots.
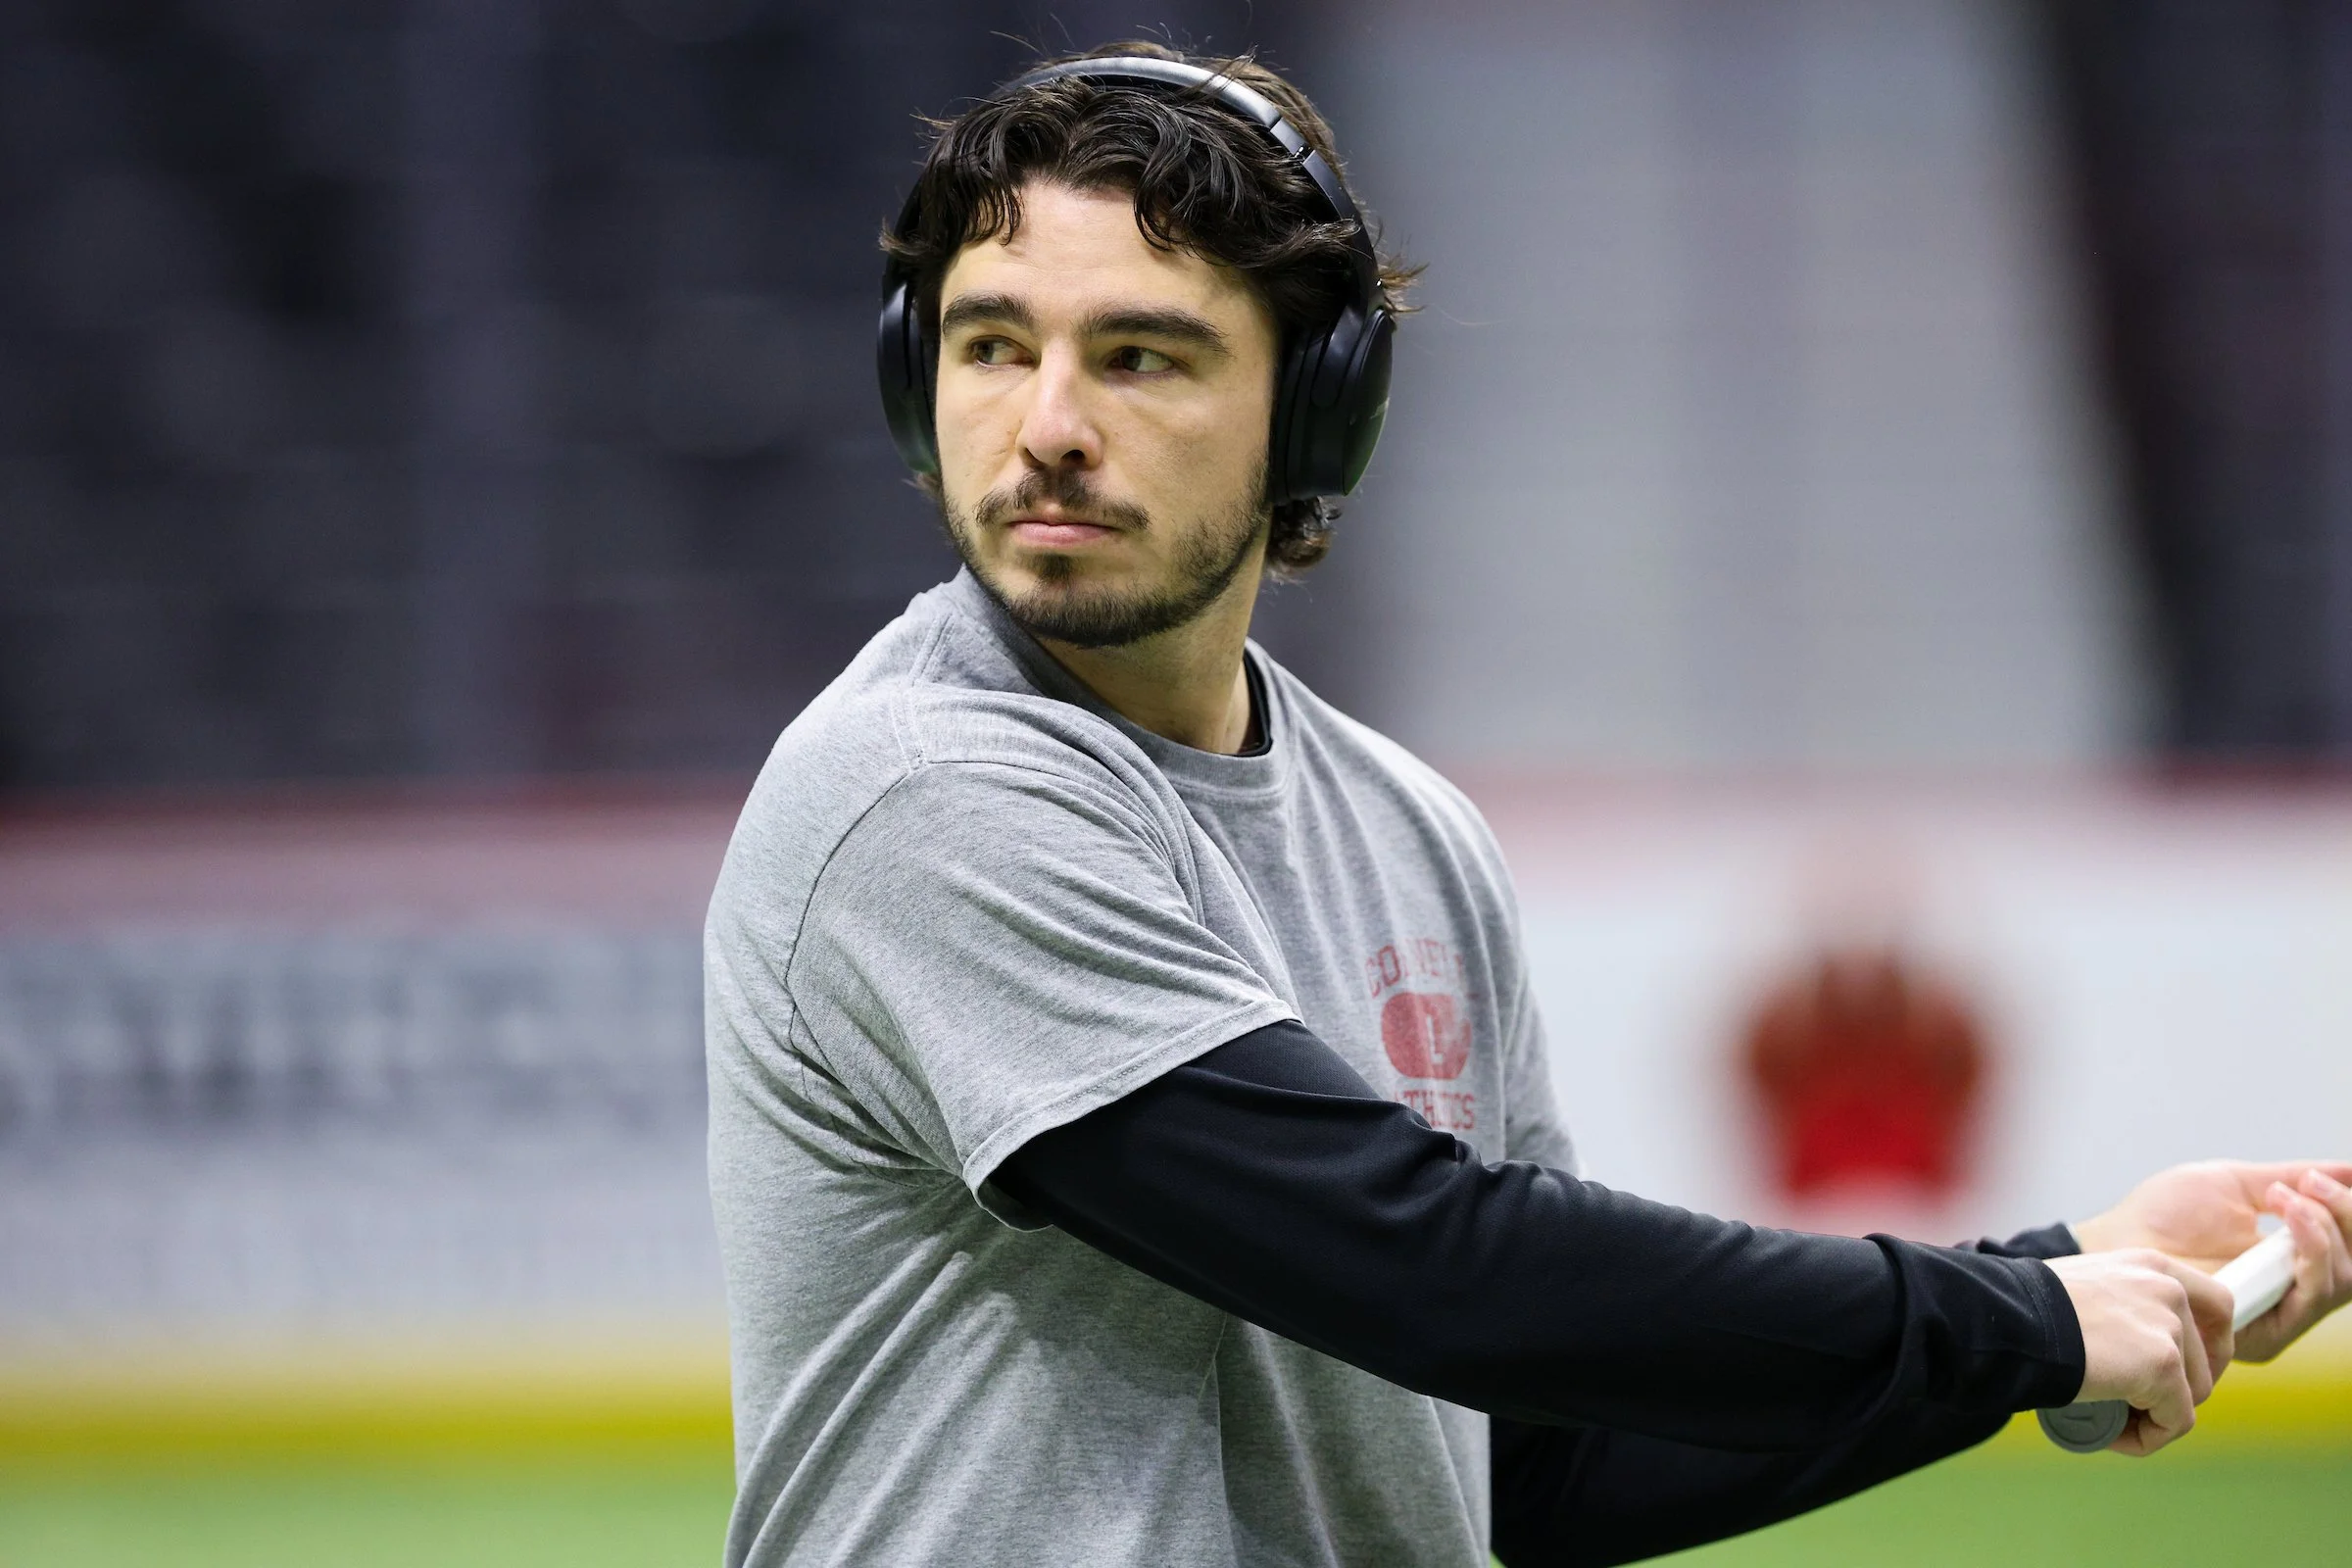
Tanner Cook, Calgary Roughnecks
GOALS
Tanner Cook (40/155) 25.8%
Andrew Kew (43/172) 25.0%
Alex Simmons (35/150) 23.3%
Jeff Teat (40/173) 23.1%
Curtis Dickson (38/170) 22.4%
Clarke Petterson (34/153) 22.2%
Connor Fields (38/171) 22.2%
Brennan O'Neill (31/144) 21.5%
Tye Kurtz (32/150) 21.3%
Keegan Bal (36/170) 21.2%
Dhane Smith (33/164) 20.1%
Ryan Smith (34/171) 19.9%
Tre Leclaire (27/141) 19.1%
Ryan Keenan (34/185) 18.4%
CJ Kirst (31/169) 18.3%
Both Tanner Cook and Andrew Kew are scoring a quarter or more of all their team’s goals so far this season. While Cook leads here, the fact that Kew is this high after missing four games due to injury earlier this year is unheard of - legit. Kew also currently leads the NLL in goals too. Below are the only NLL goal-scoring leaders who did not play every single regular season game for their team (due to injury in all cases). No one comes close to missing the number of games Kew has this year though.
Season – Player (Team) Goals in Games Played (Full Season GP)
2019 – Callum Crawford (New England) 48 in 16 (18)
2012 – *John Grant (Colorado) 50 in 14 (16)
2007 – *John Grant (Rochester) 51 in 15 (16)
2005 – John Grant (Rochester) 49 in 15 (16)
1999 – *Gary Gait (Baltimore) 50 in 11 (12)
1992 – Paul Gait (Detroit) 33 in 7 (8)
*Voted NLL MVP. MVP Award established in 1994.
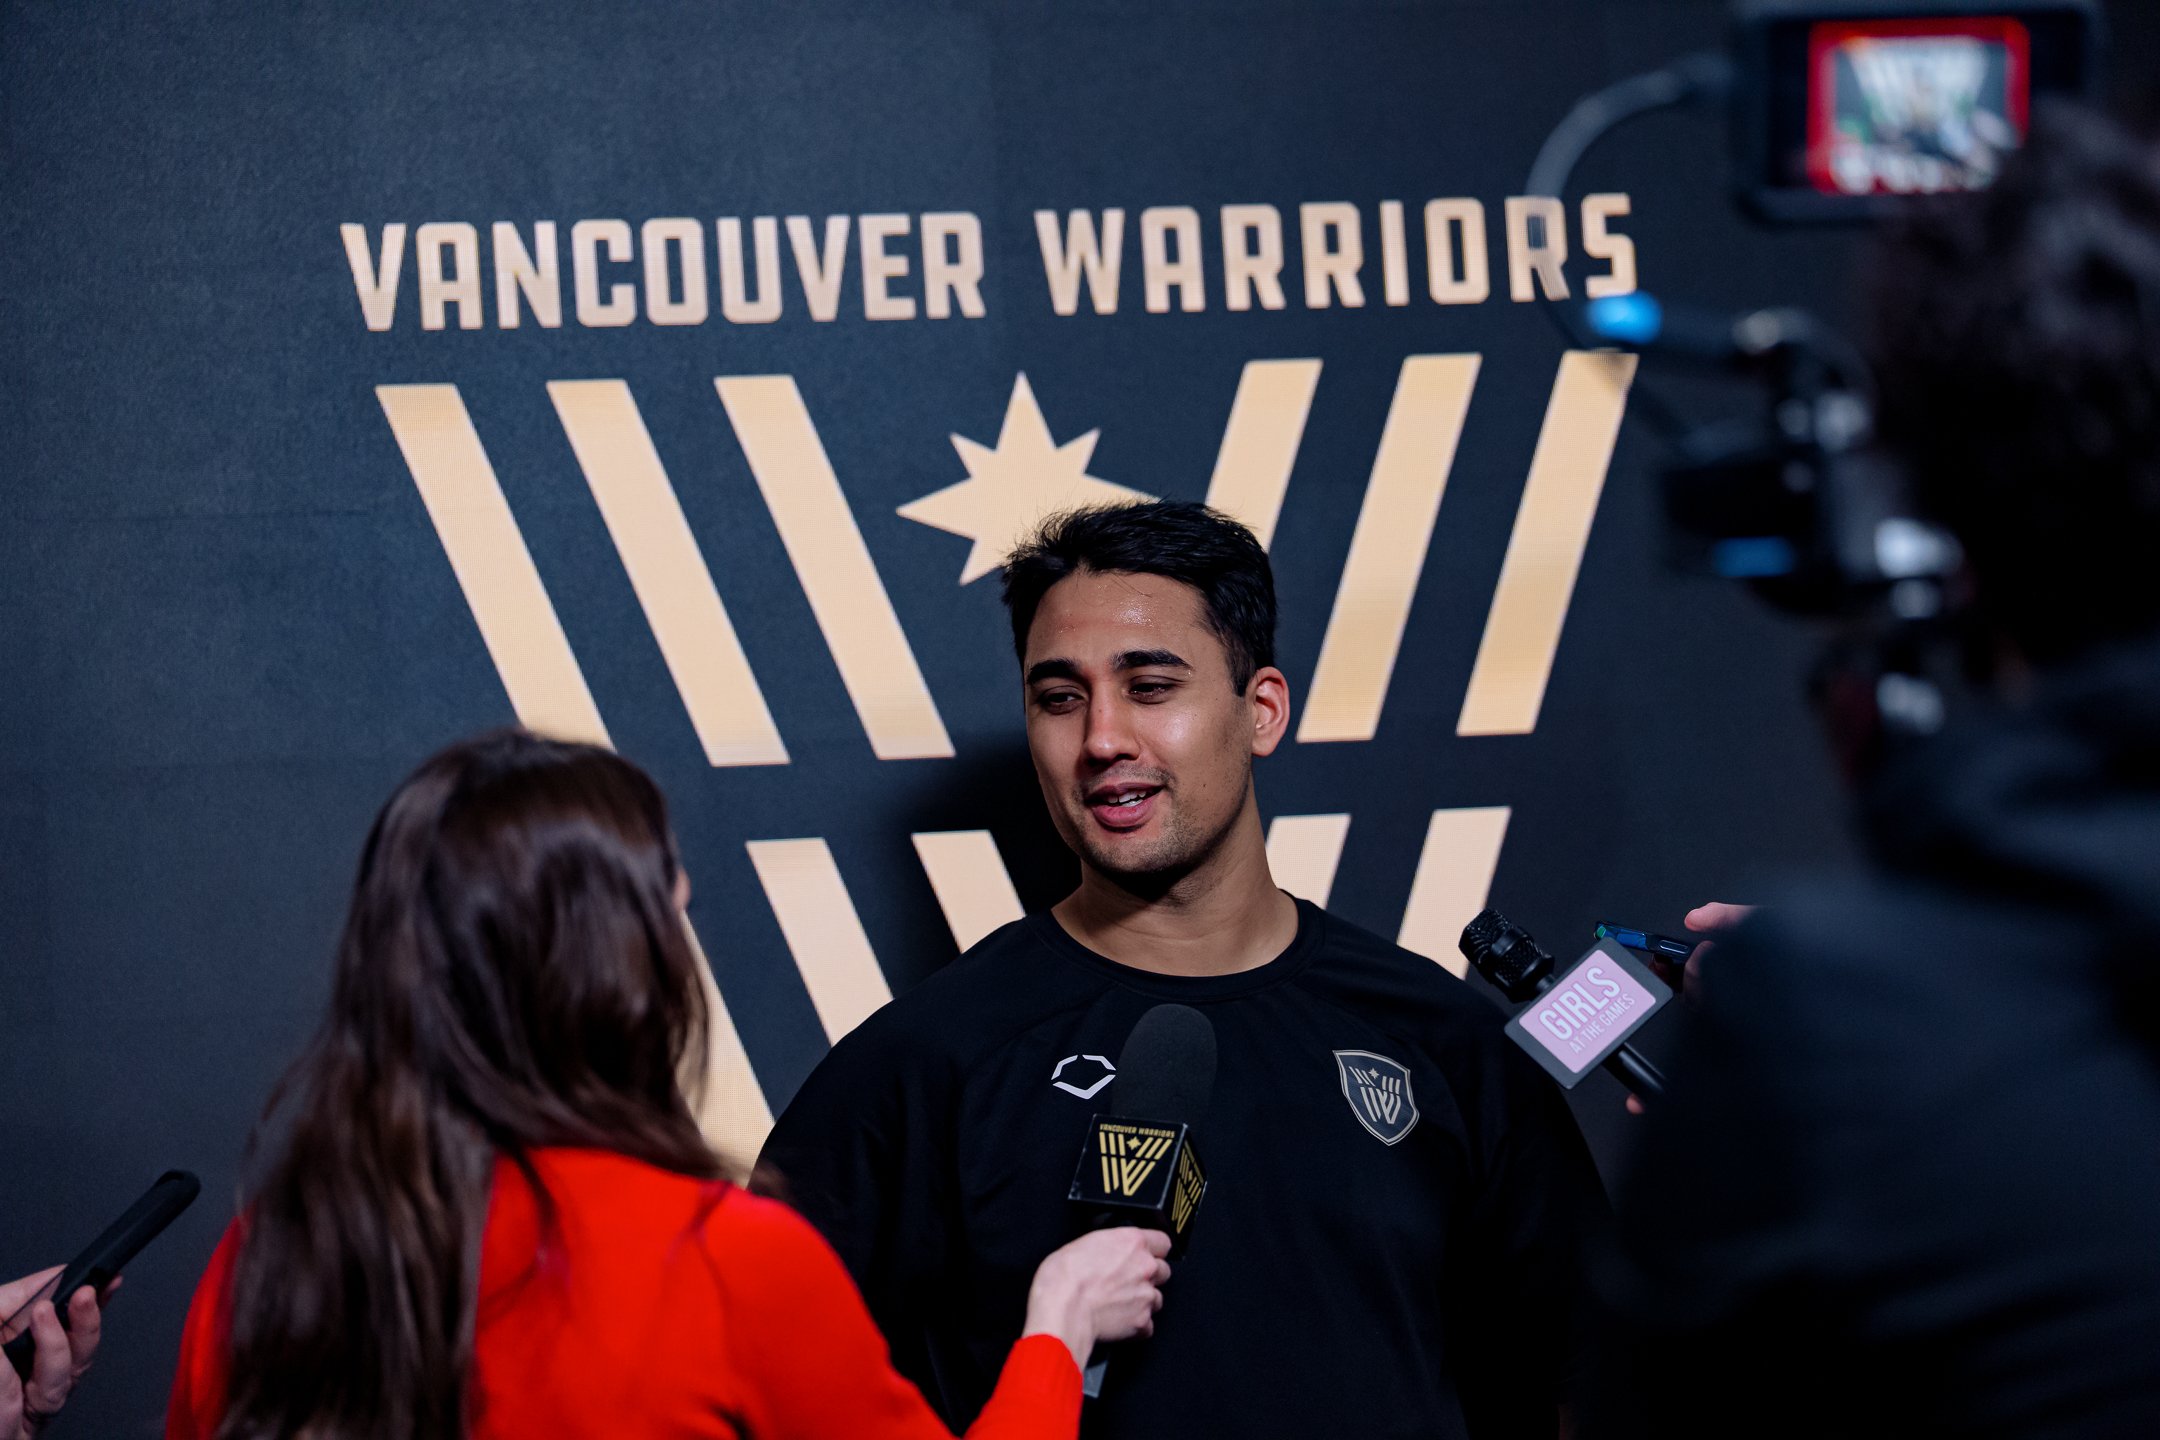
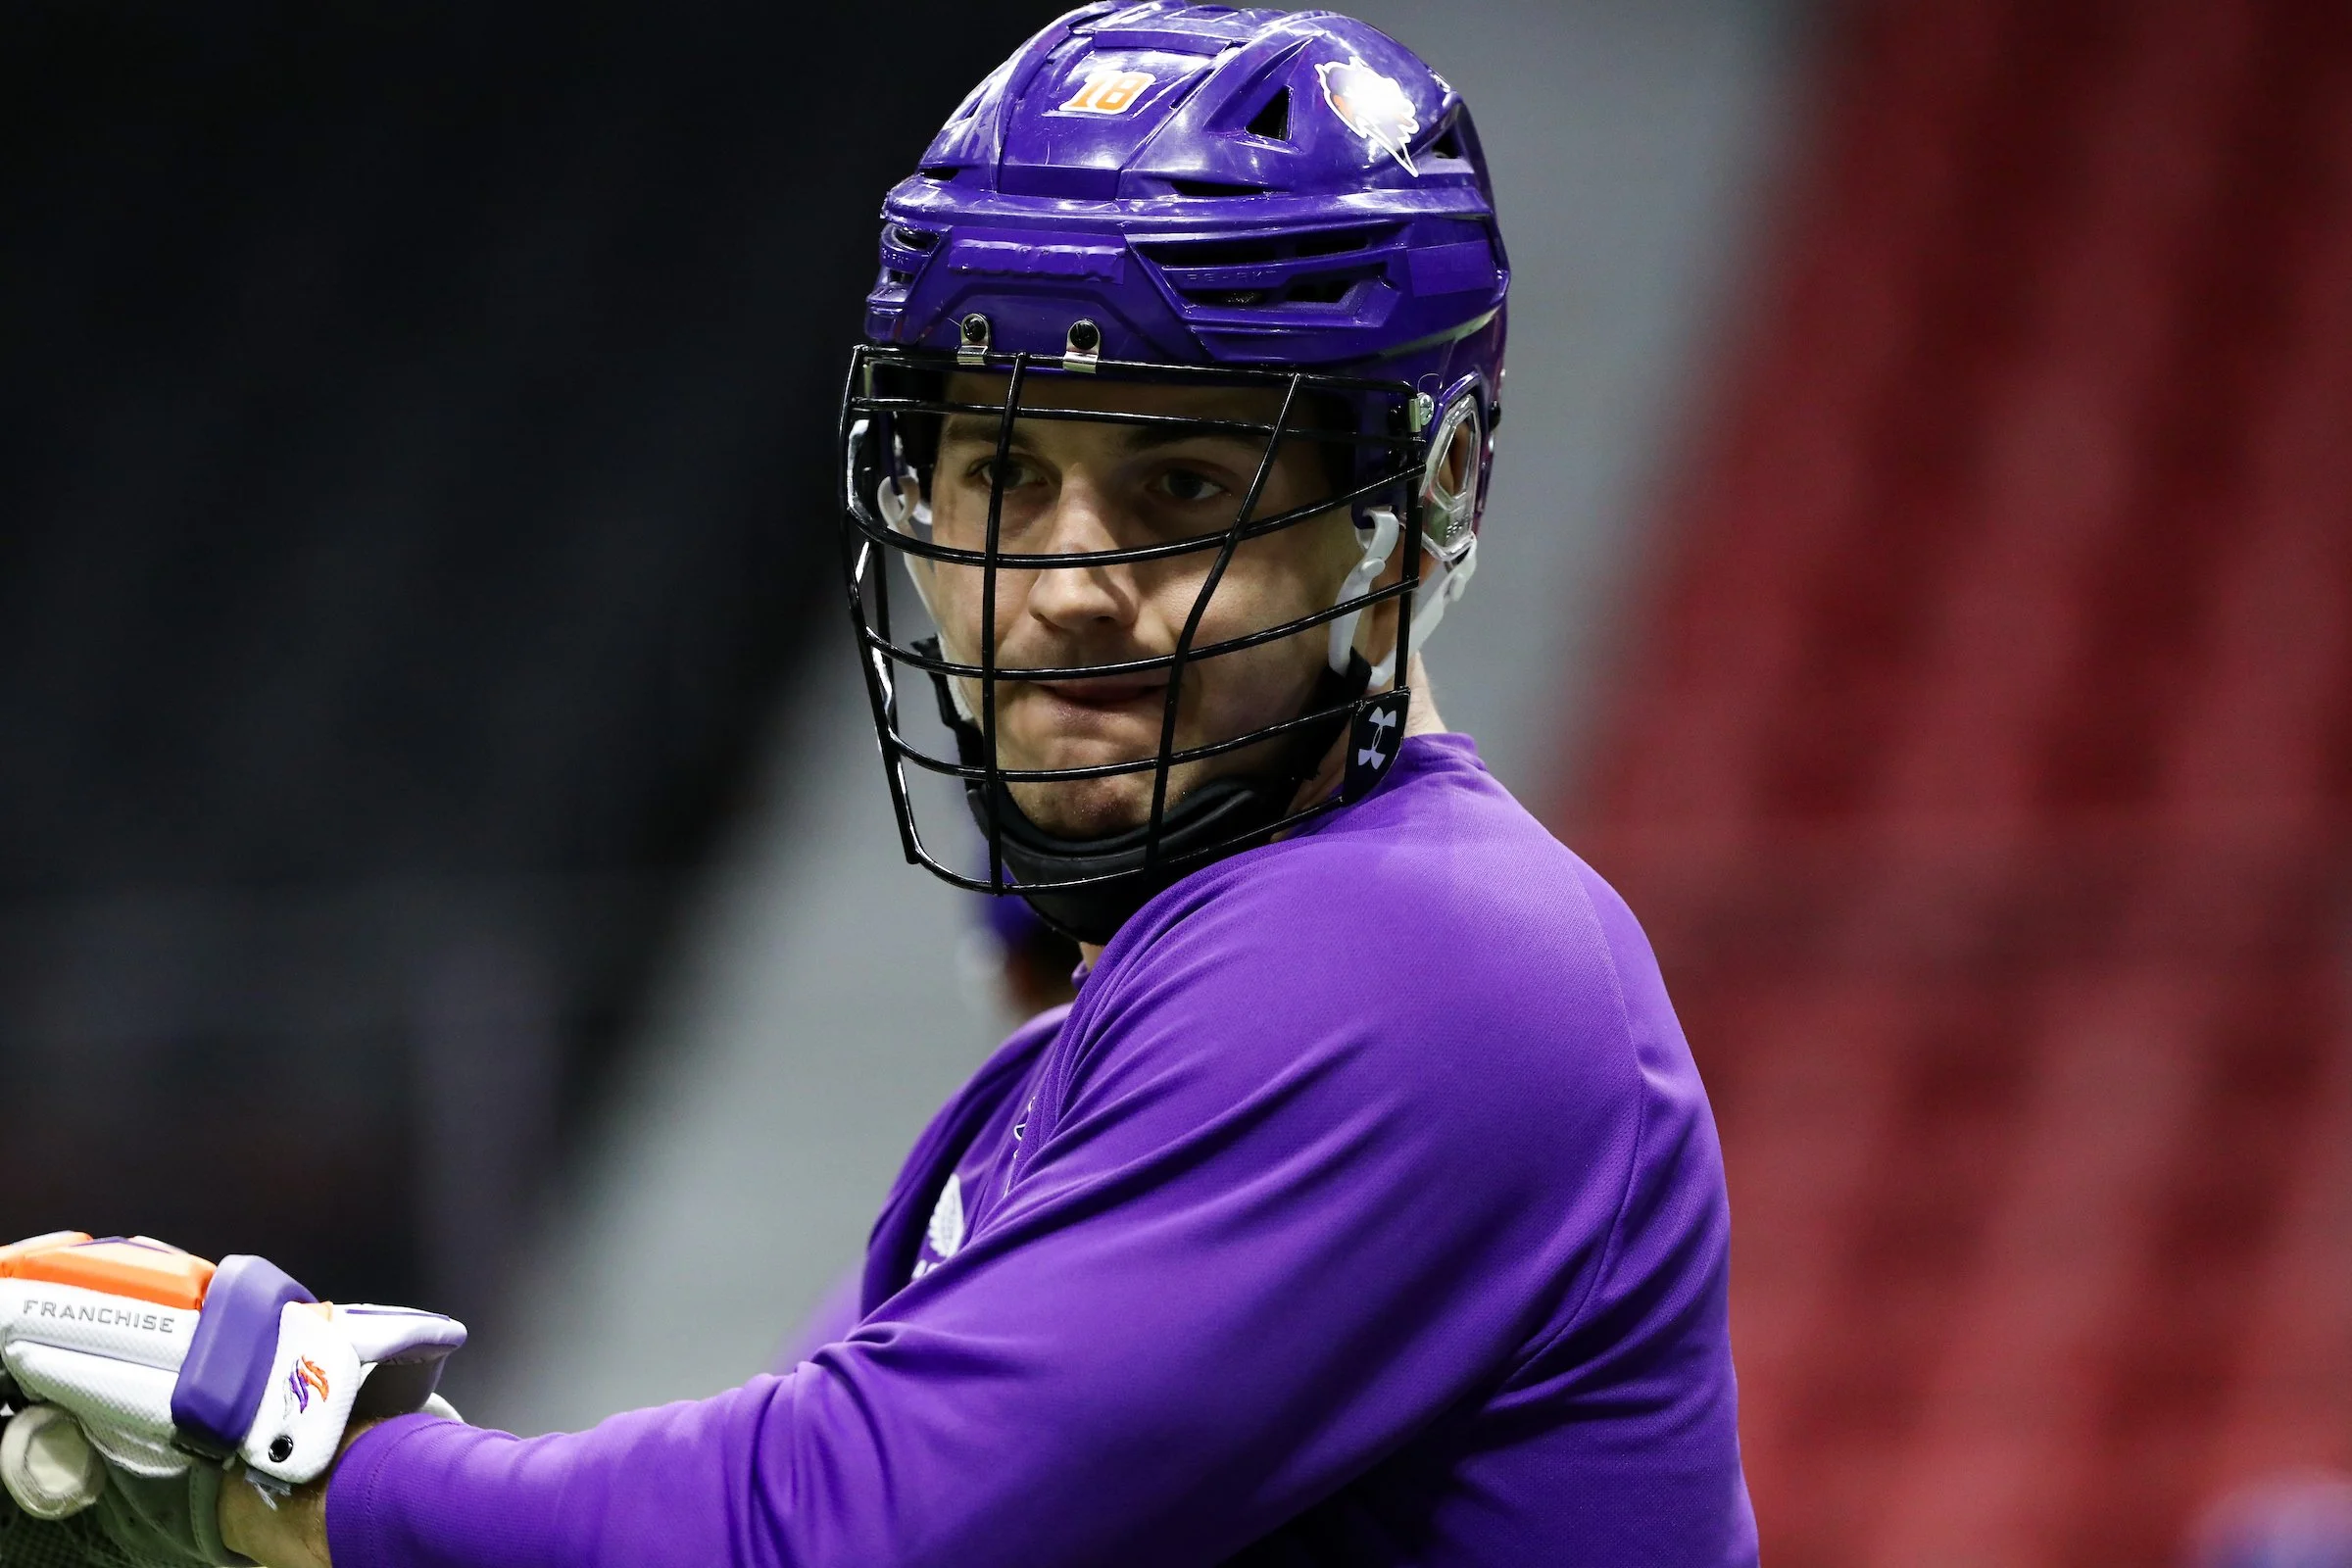
Keegan Bal, Vancouver Warriors (Photo: Jordan Leigh)
POINTS
Keegan Bal (107/170) 62.9%
Jeff Teat (106/173) 61.3%
Alex Simmons (89/150) 59.3%
Dhane Smith (96/164) 58.5%
Connor Fields (97/171) 56.7%
Josh Byrne (91/164) 55.5%
Tyler Pace (82/155) 52.9%
Rob Hellyer (91/173) 52.6%
Tanner Cook (80/155) 51.6%
Ryan Lancbury (87/171) 50.9%
Clarke Petterson (77/153) 50.3%
Mitch Jones (86/176) 48.9%
Tye Kurtz (70/150) 46.7%
Jonathan Donville (80/176) 45.5%
Ryan Keenan (84/185) 45.4%
Like we outlined earlier, Teat is relied on heavily here yet again, but he’s not #1 for the first time in a bit. It’s actually Vancouver’s Keegan Bal, who is in on 63% of all Warriors goals so far this season. Since coming out of the pandemic, here are the percentages of Vancouver team goals that Bal has either scored or assisted on…
2022: 50%
2023: 46%
2024: 51%
2025: 57%
2026: 63%
While some felt the offseason addition of players like Jesse King or Curtis Dickson would take away from a player like Bal, it’s actually been the exact opposite, with Bal being relied on more than ever.
Jake Withers, Halifax Thunderbirds (Photo: Greg Mason)
LOOSE BALLS
Jake Withers (192/1,035) 18.6%
Zach Currier (163/1,045) 15.6%
Callum Jones (156/1,129) 13.8%
Justin Inacio (133/991) 13.4%
Robert Hope (124/1,024) 12.1%
Matthew Paolatto (124/1,024) 12.1%
Alex Pace (118/1,002) 11.8%
Ryan Terefenko (117/1,035) 11.3%
Reid Bowering (96/868) 11.1%
Mitch de Snoo (115/1,071) 10.7%
Trevor Baptiste (111/1,045) 10.6%
Graeme Hossack (107/1,035) 10.3%
Will Johansen (110/1,074) 10.2%
Brent Noseworthy (115/1,129) 10.2%
Mike Messenger (122/1,199) 10.2%
Keegan Bal (85/868) 9.8%
Not much of a shocker to see how high Jake Withers is here, but what is a bit shocking is how few face-off takers cracked this list. The fact that Zach Currier, who now plays a ton of forward minutes versus starting out the backdoor as we were used to seeing prior to landing in San Diego, still ranks so high here as essentially a forward is kinda crazy. The next closest forwad is Bal, who actually is just behind defender Reid Bowering for the team lead in loosies. Bal is just 5LB shy of becoming this season’s second 30/60/90 (G/A/LB) member. Teat was the first.
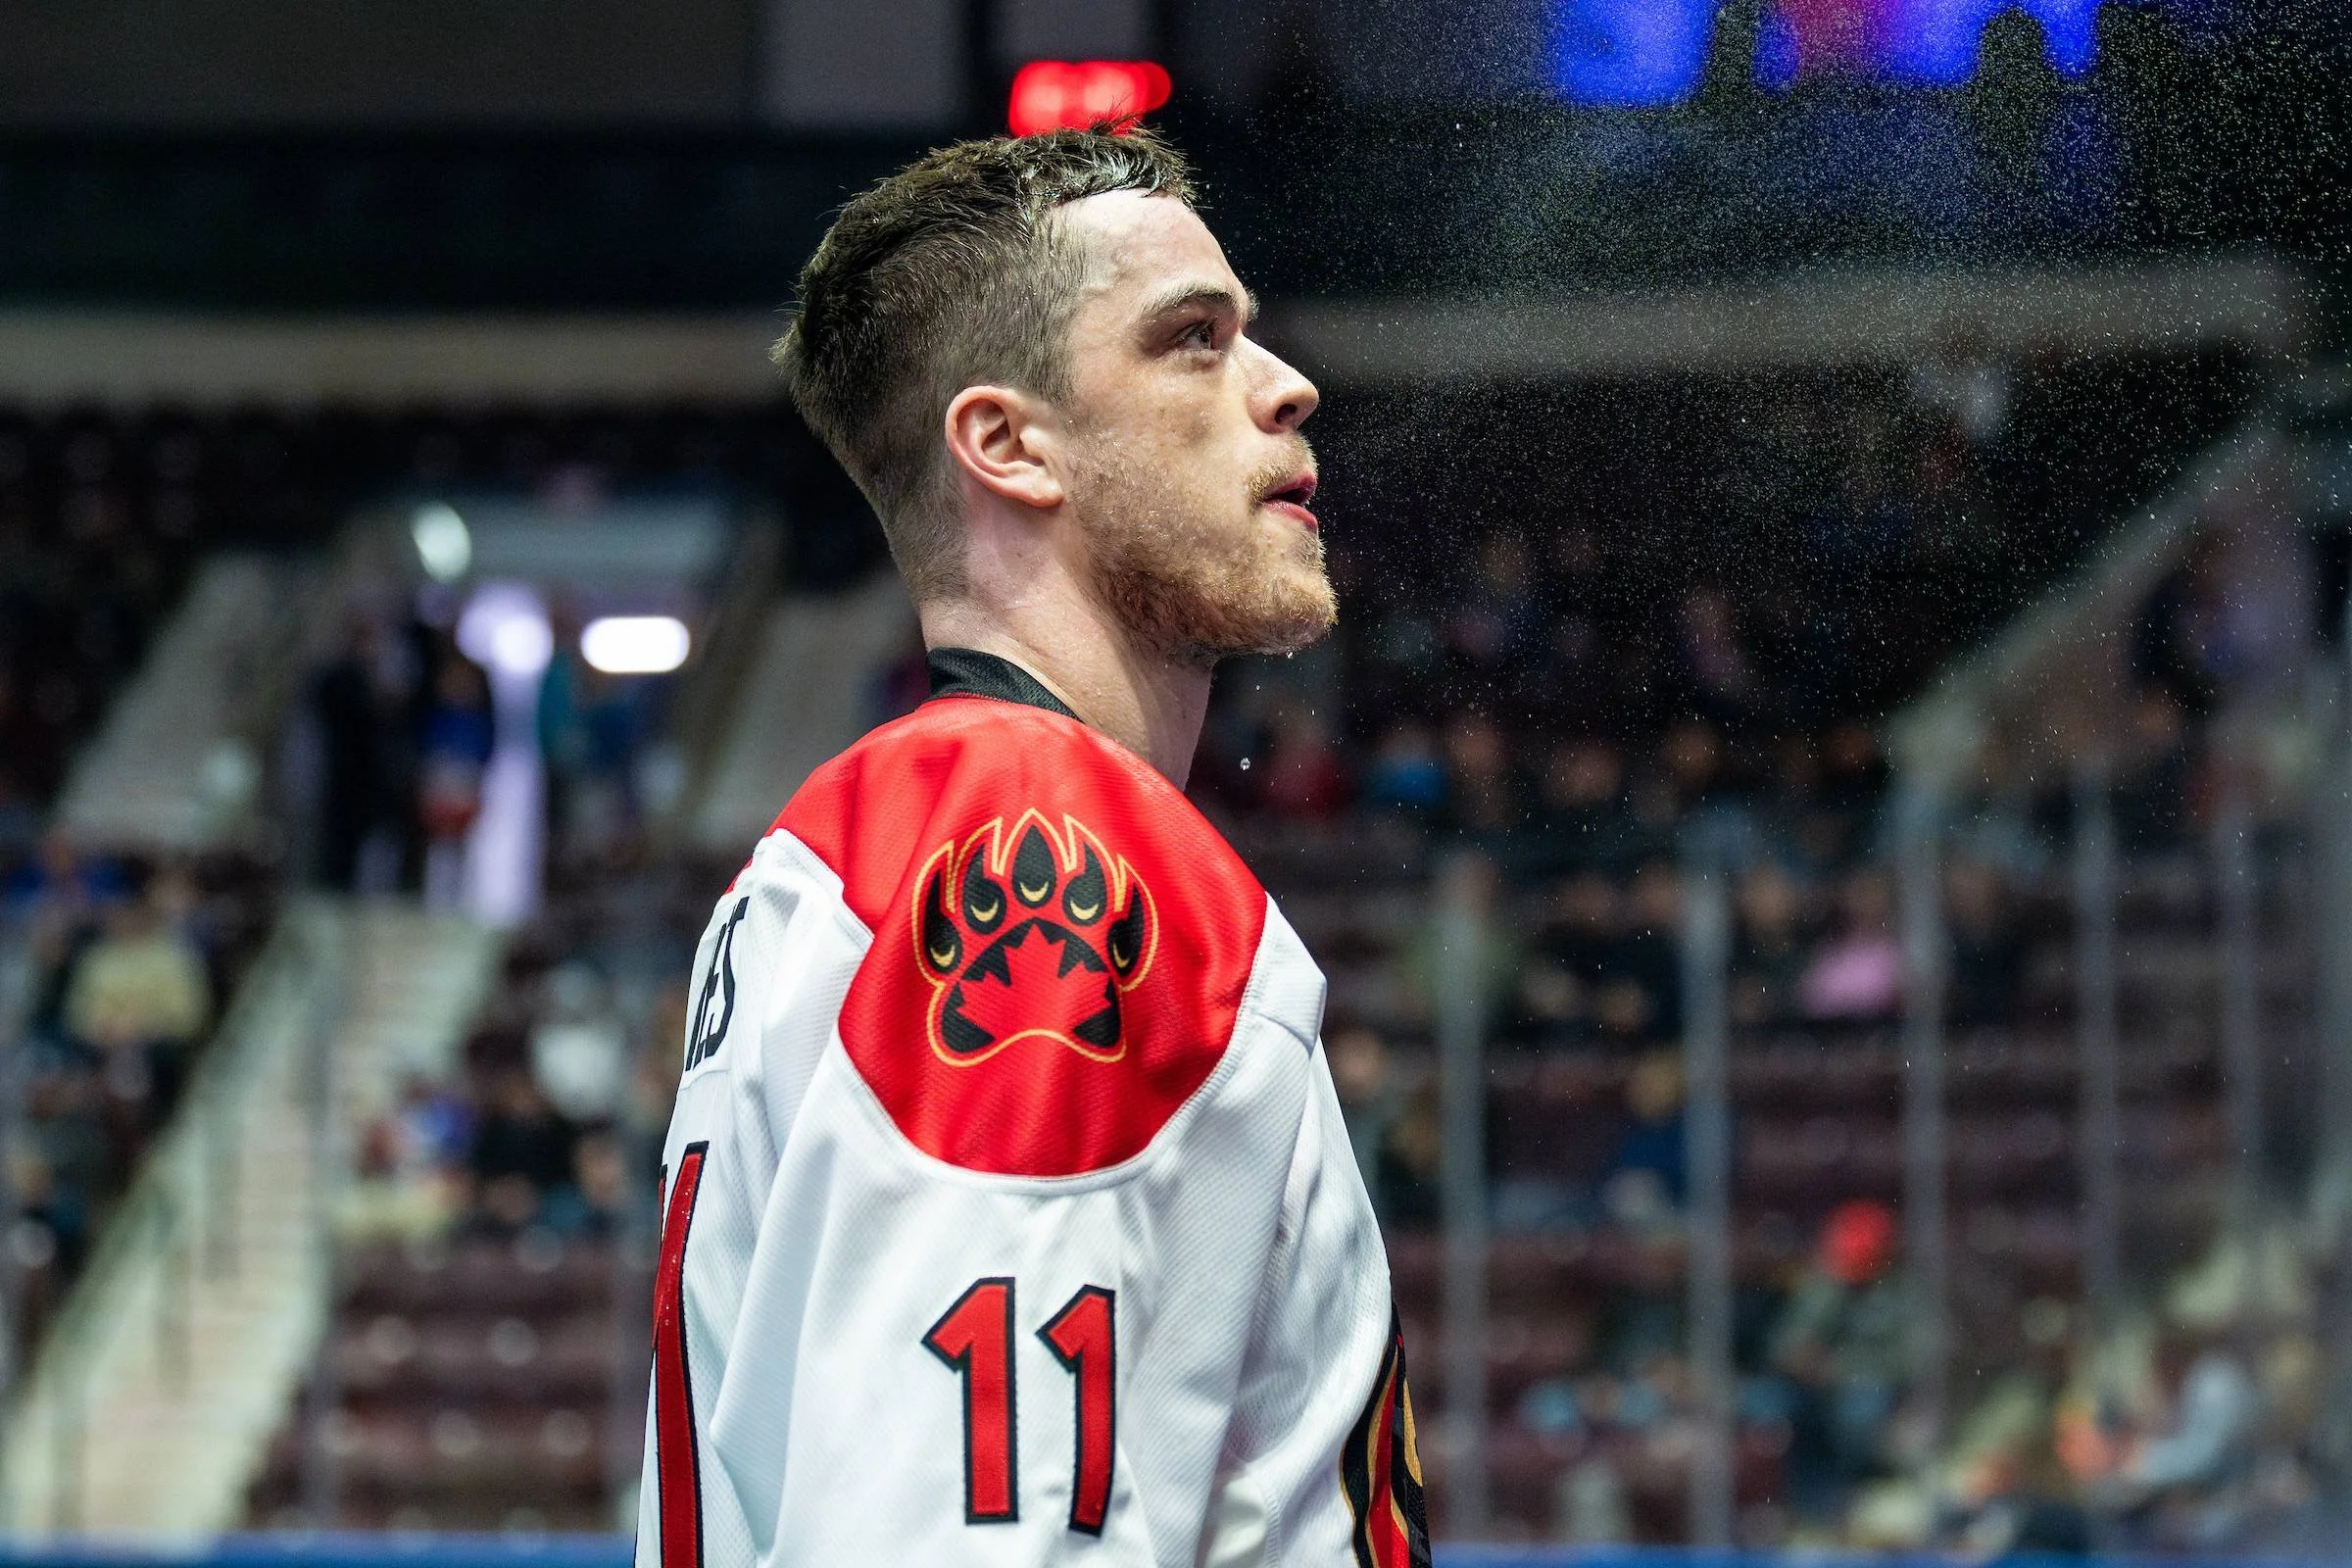
Callum Jones, Ottawa Black Bears (Photo: Christian Bender)
CAUSED TURNOVERS
Callum Jones (30/134) 22.4%
Matt Hossack (29/137) 21.2%
Connor Kirst (20/98) 20.4%
Ryan Dilks (20/99) 20.2%
Graeme Hossack (20/116) 17.2%
Nick Chaykowsky (22/129) 17.1%
Brad Kri (27/160) 16.9%
Michael Grace (26/159) 16.4%
Will Johansen (21/129) 16.3%
Cam Wyers (17/105) 16.2%
Zach Currier (20/125) 16.0%
Jake Stevens (21/134) 15.7%
Colton Armstrong (18/116) 15.5%
Tyson Bell (18/116) 15.5%
Danny Logan (19/125) 15.2%
Brayden Laity (15/99) 15.2%
Ottawa’s Callum Jones is first here, third in loosies above, and even cracks the most relied-on blocker list below. He’s one of the very few defenders to make all three D category countdowns today, and is a big reason why we declared him our overwhelming favourite for DPOTY in last week’s NLL Player Rankings.
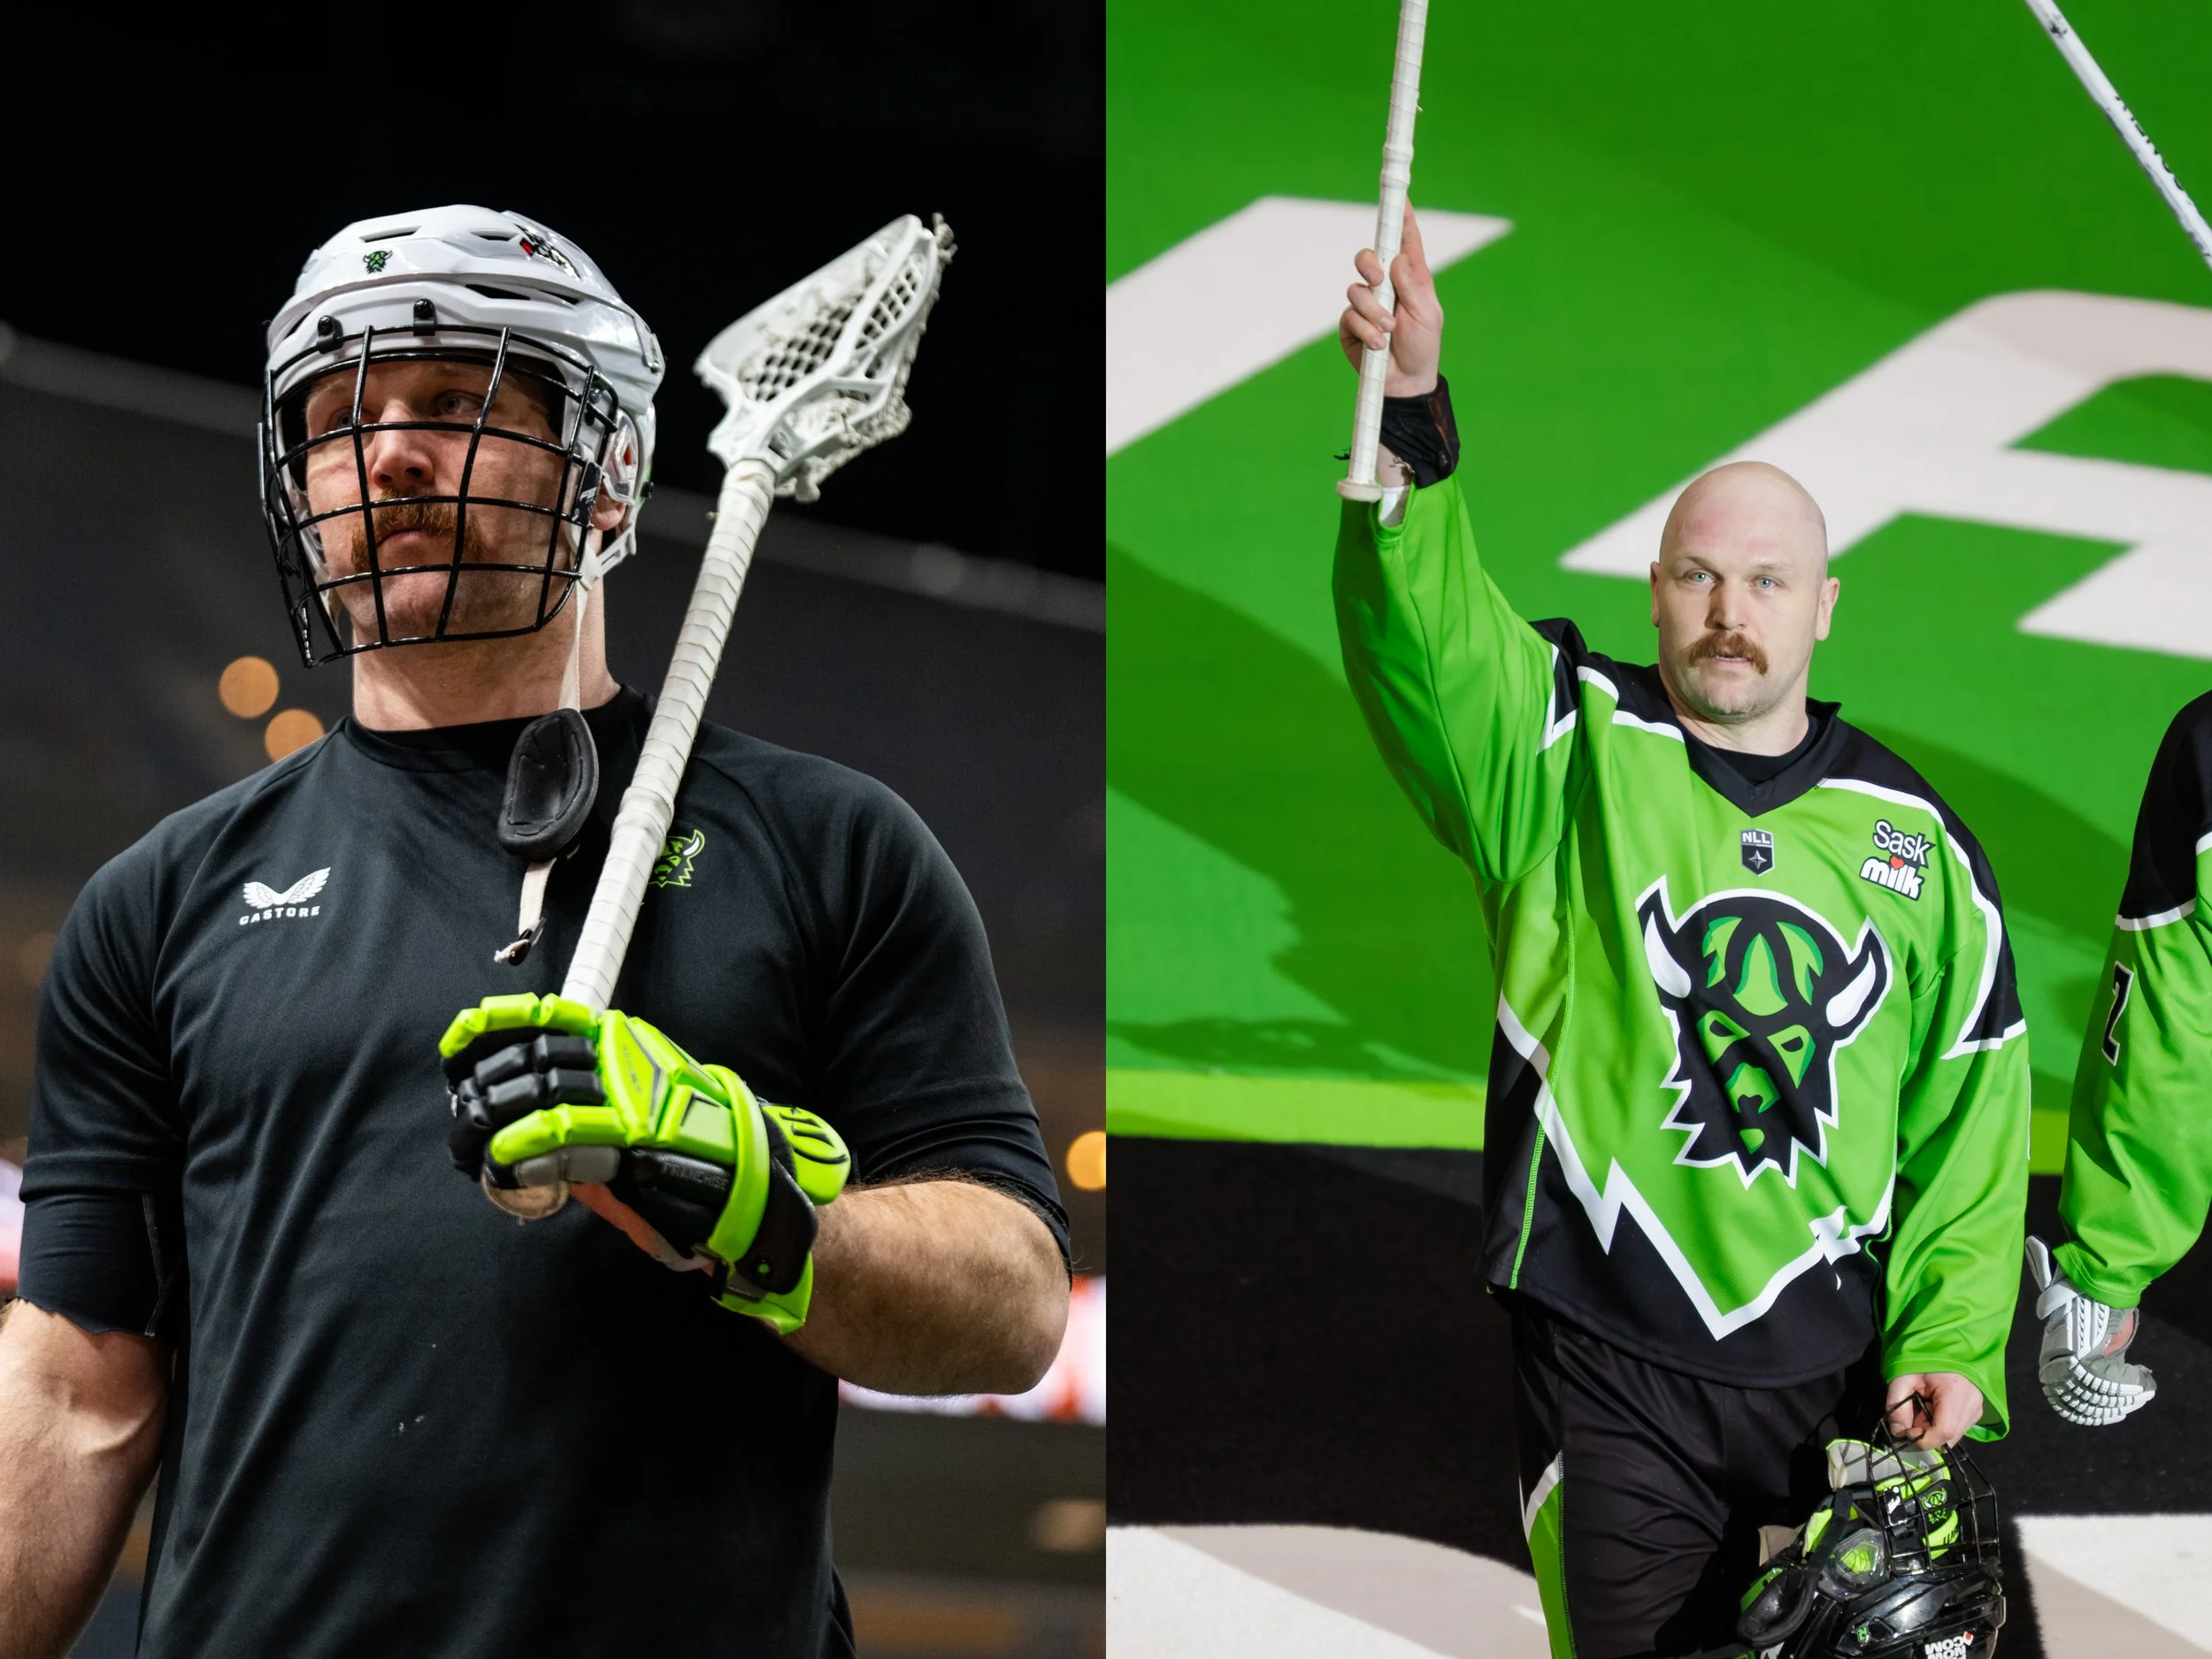
Mike Messenger, Saskatchewan Rush (Photo: Caroline Sherman)
BLOCKED SHOTS
Mike Messenger (27/91) 29.7%
Robert Hope (22/79) 27.8%
Paul Dawson (31/122) 25.4%
Graeme Hossack (14/68) 20.6%
John LaFontaine (12/61) 19.7%
Johnny Pearson (13/68) 19.1%
Ian Llord (17/89) 19.1%
Colton Watkinson (16/84) 19.0%
Ryan Wagner (13/71) 18.3%
Mitch de Snoo (22/122) 18.0%
James Barclay (13/73) 17.8%
Jake Withers (12/68) 17.6%
Jake Boudreau (16/91) 17.6%
Callum Jones (11/63) 17.5%
Eli Salama (15/86) 17.4%
While he doesn’t lead the league in blocked shots ahead of Week 19 (Buffalo’s Paul Dawson does, and three other Bandits – Mitch de Snoo, Steve Priolo and Cam Wyers – are also in the Top 10 right now), no team relies on a player for a higher percentage of their team’s blocks than Mike Messenger in Saskatchewan, who is making almost exactly a third of all Rush blocks. While he missed mention in our DPOTY breakdown last week due to his classification as a Transition Player, the fact that Messenger can’t be considered for both awards (D & T), makes absolute zero sense.
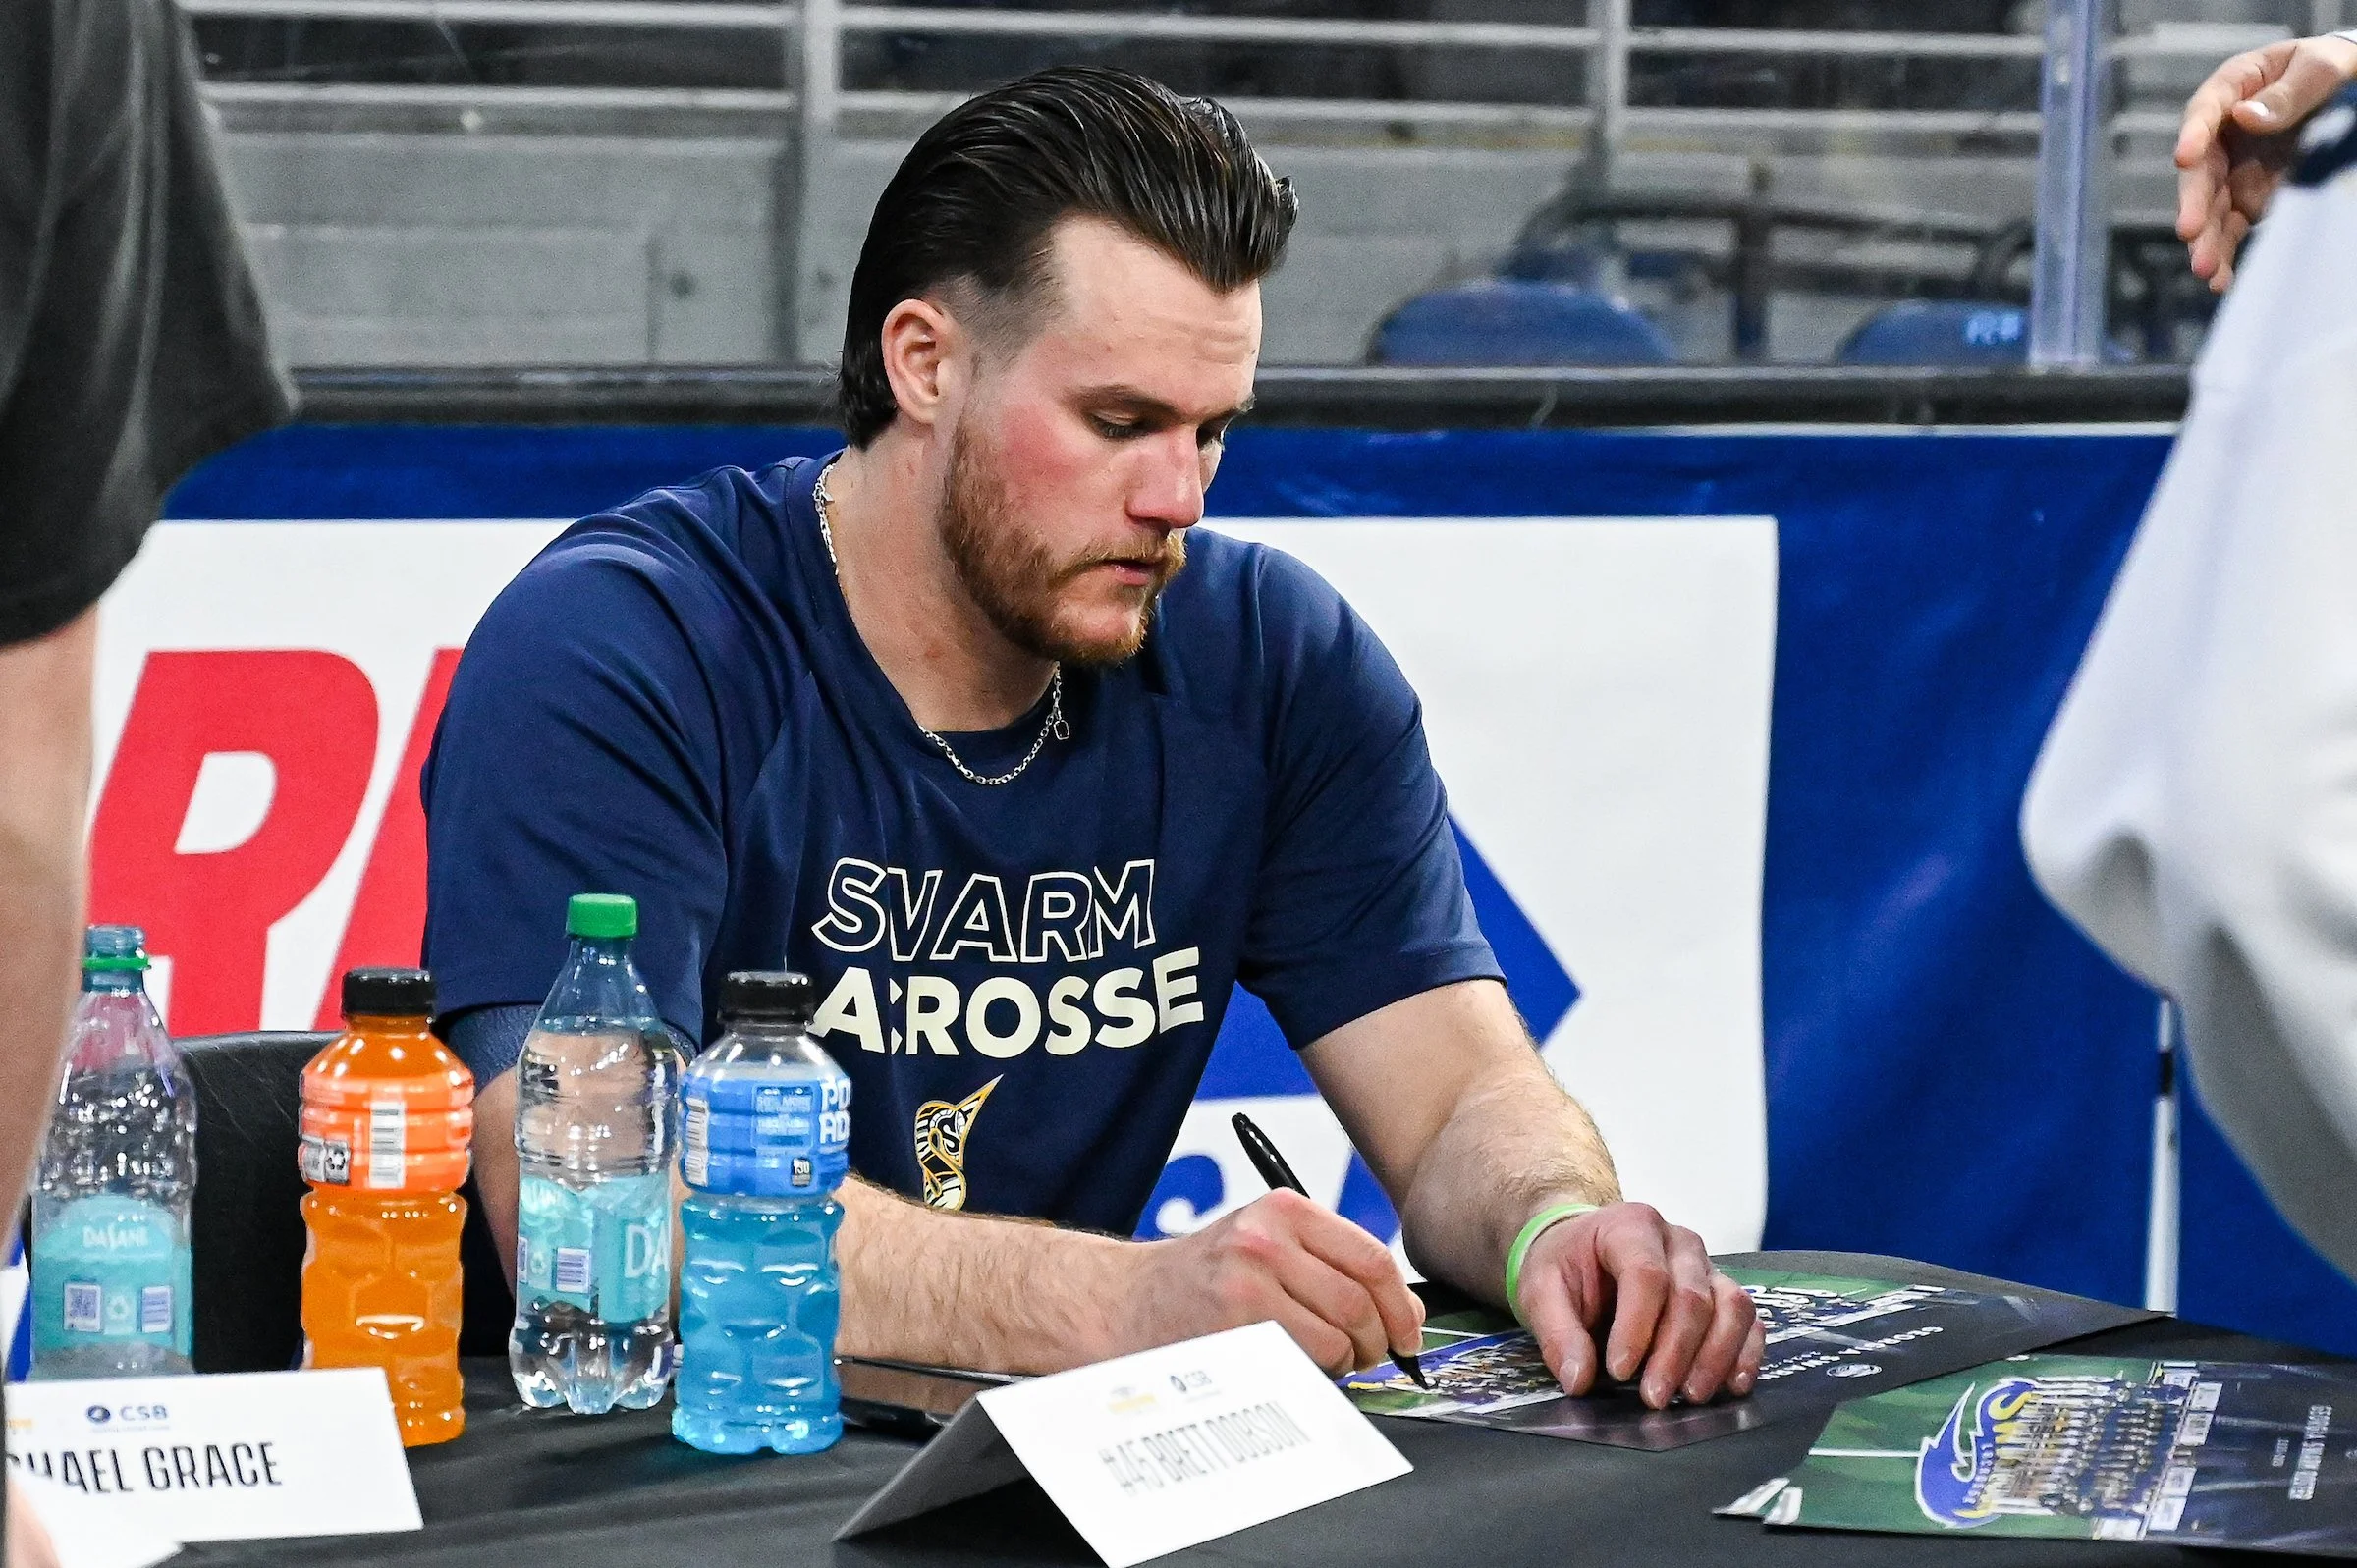
Brett Dobson, Georgia Swarm (Photo: Victoria Adkins)
NLL TOP 30: WEEK 19
TW. (LW) Player, Team (Pos.)
1. (1) Brett Dobson, Georgia (G)
2. (2) Keegan Bal, Vancouver (F)
3. (3) Jeff Teat, Ottawa (F)
4. (4) Dhane Smith, Buffalo (F)
5. (5) Andrew Kew, Colorado (F)
6. (6) Christian Del Bianco, Vancouver (G)
7. (7) Zach Currier, San Diego (F)
8. (8) Callum Jones, Ottawa (D)
9. (9) Connor Fields, Rochester (F)
10. (11) Josh Byrne, Buffalo (F)
11. (10) Mitch Jones, Las Vegas (F)
12. (13) Ryan Lanchbury, Rochester (F)
13. (15) Alex Simmons, Oshawa (F)
14. (17) Tanner Cook, Calgary (F)
15. (12) Mike Messenger, Saskatchewan (T)
16. (14) Jack Hannah, Colorado (F)
17. (18) Jonathan Donville, Las Vegas (F)
18. (21) Jordan MacIntosh, Georgia (T)
19. (20) Rob Hellyer, Ottawa (F)
20. (16) Ryan Keenan, Saskatchewan (F)
21. (19) Dillon Ward, Colorado (G)
22. (25) Jake Boudreau, Saskatchewan (T)
23. (22) CJ Kirst, Toronto (F)
24. (23) Will Malcom, Colorado (F)
25. (24) Curtis Dickson, Vancouver (F)
26. (30) Tyler Pace, Calgary (F)
27. (26) Connor Kirst, Las Vegas (T)
28. (27) Clarke Petterson, Halifax (F)
29. (NR) Chris Cloutier, Las Vegas (F)
30. (NR) Warren Hill, Halifax (G)